Tips for Diagrams
Have a Strategic Layout
The layout determines where you place your elements in the diagram. This is not just about making it look nice and tidy; it is another opportunity to convey extra information to the reader and emphasize structural elements in the diagram that go beyond how the graph is connected.
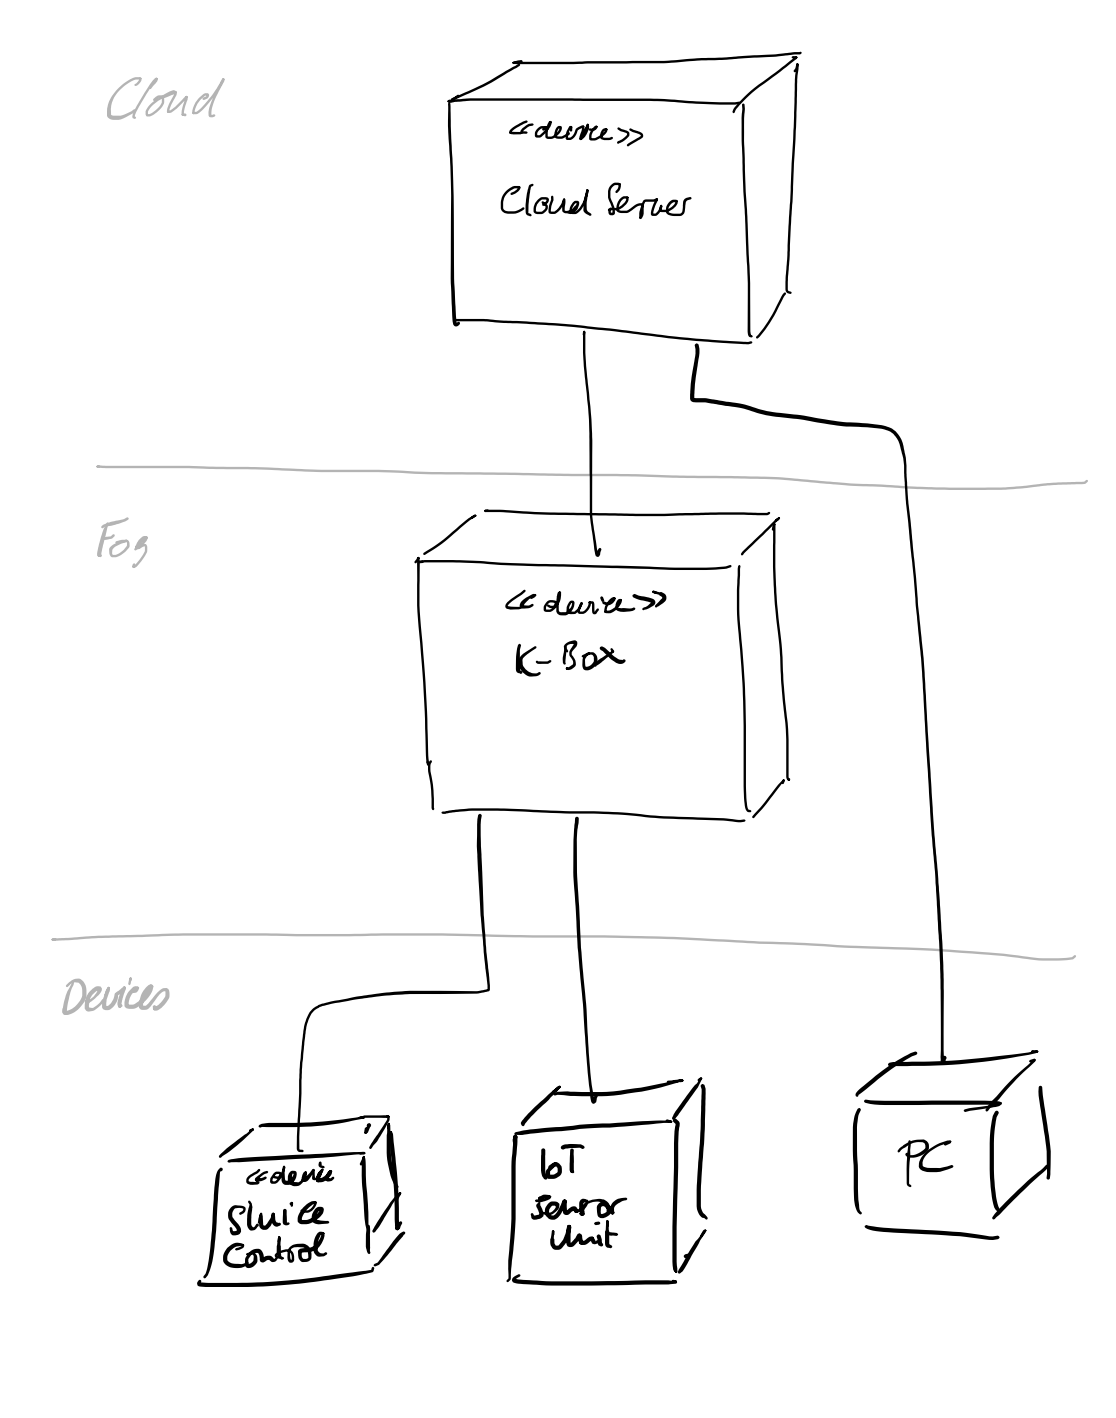
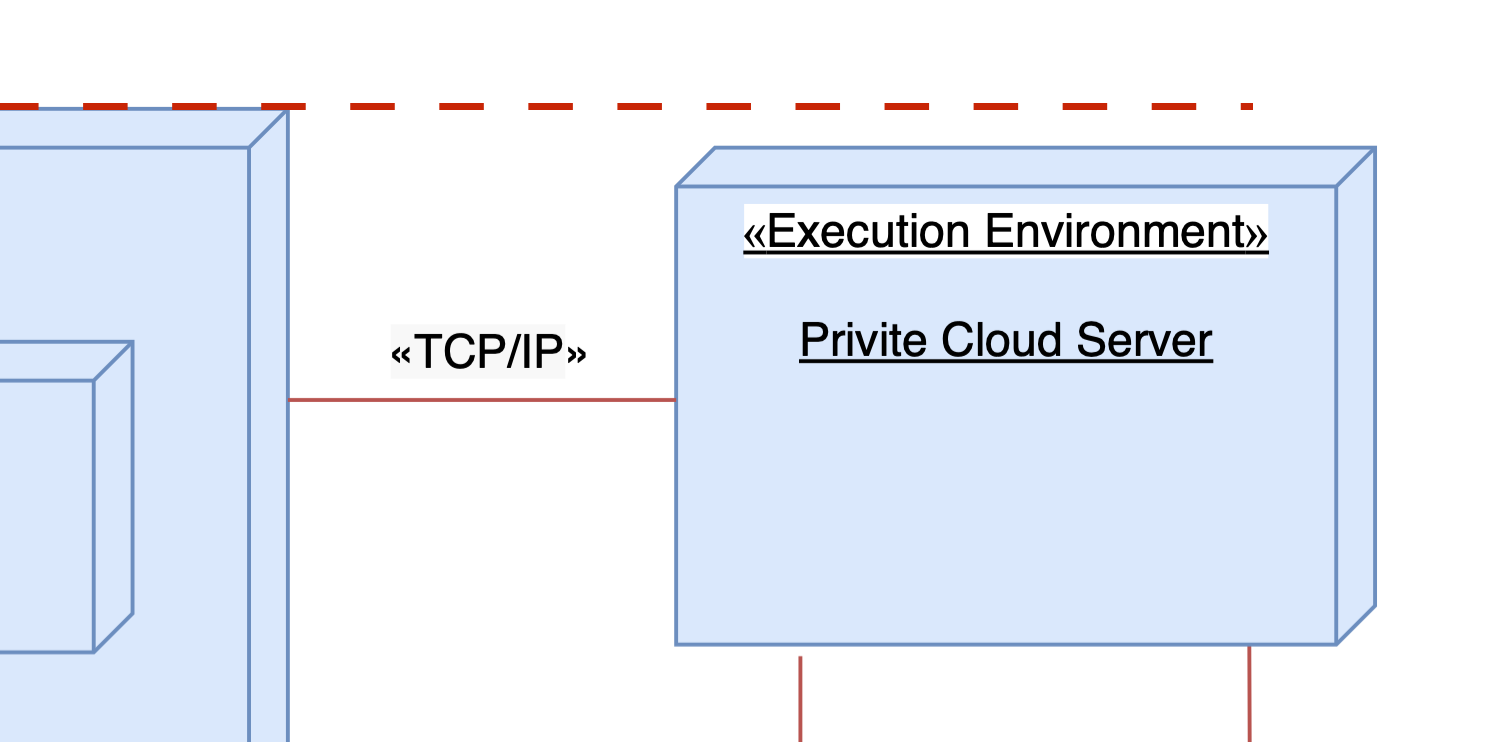
The figure below shows a deployment diagram where the strategy is to place the nodes not only dependent to their graph structure, but also to their hierarchy in the system. Devices running in the cloud are shown at the top and devices running as endpoints (like small devices) are shown in the lowest layer. This already conveys some form of order to the diagram.
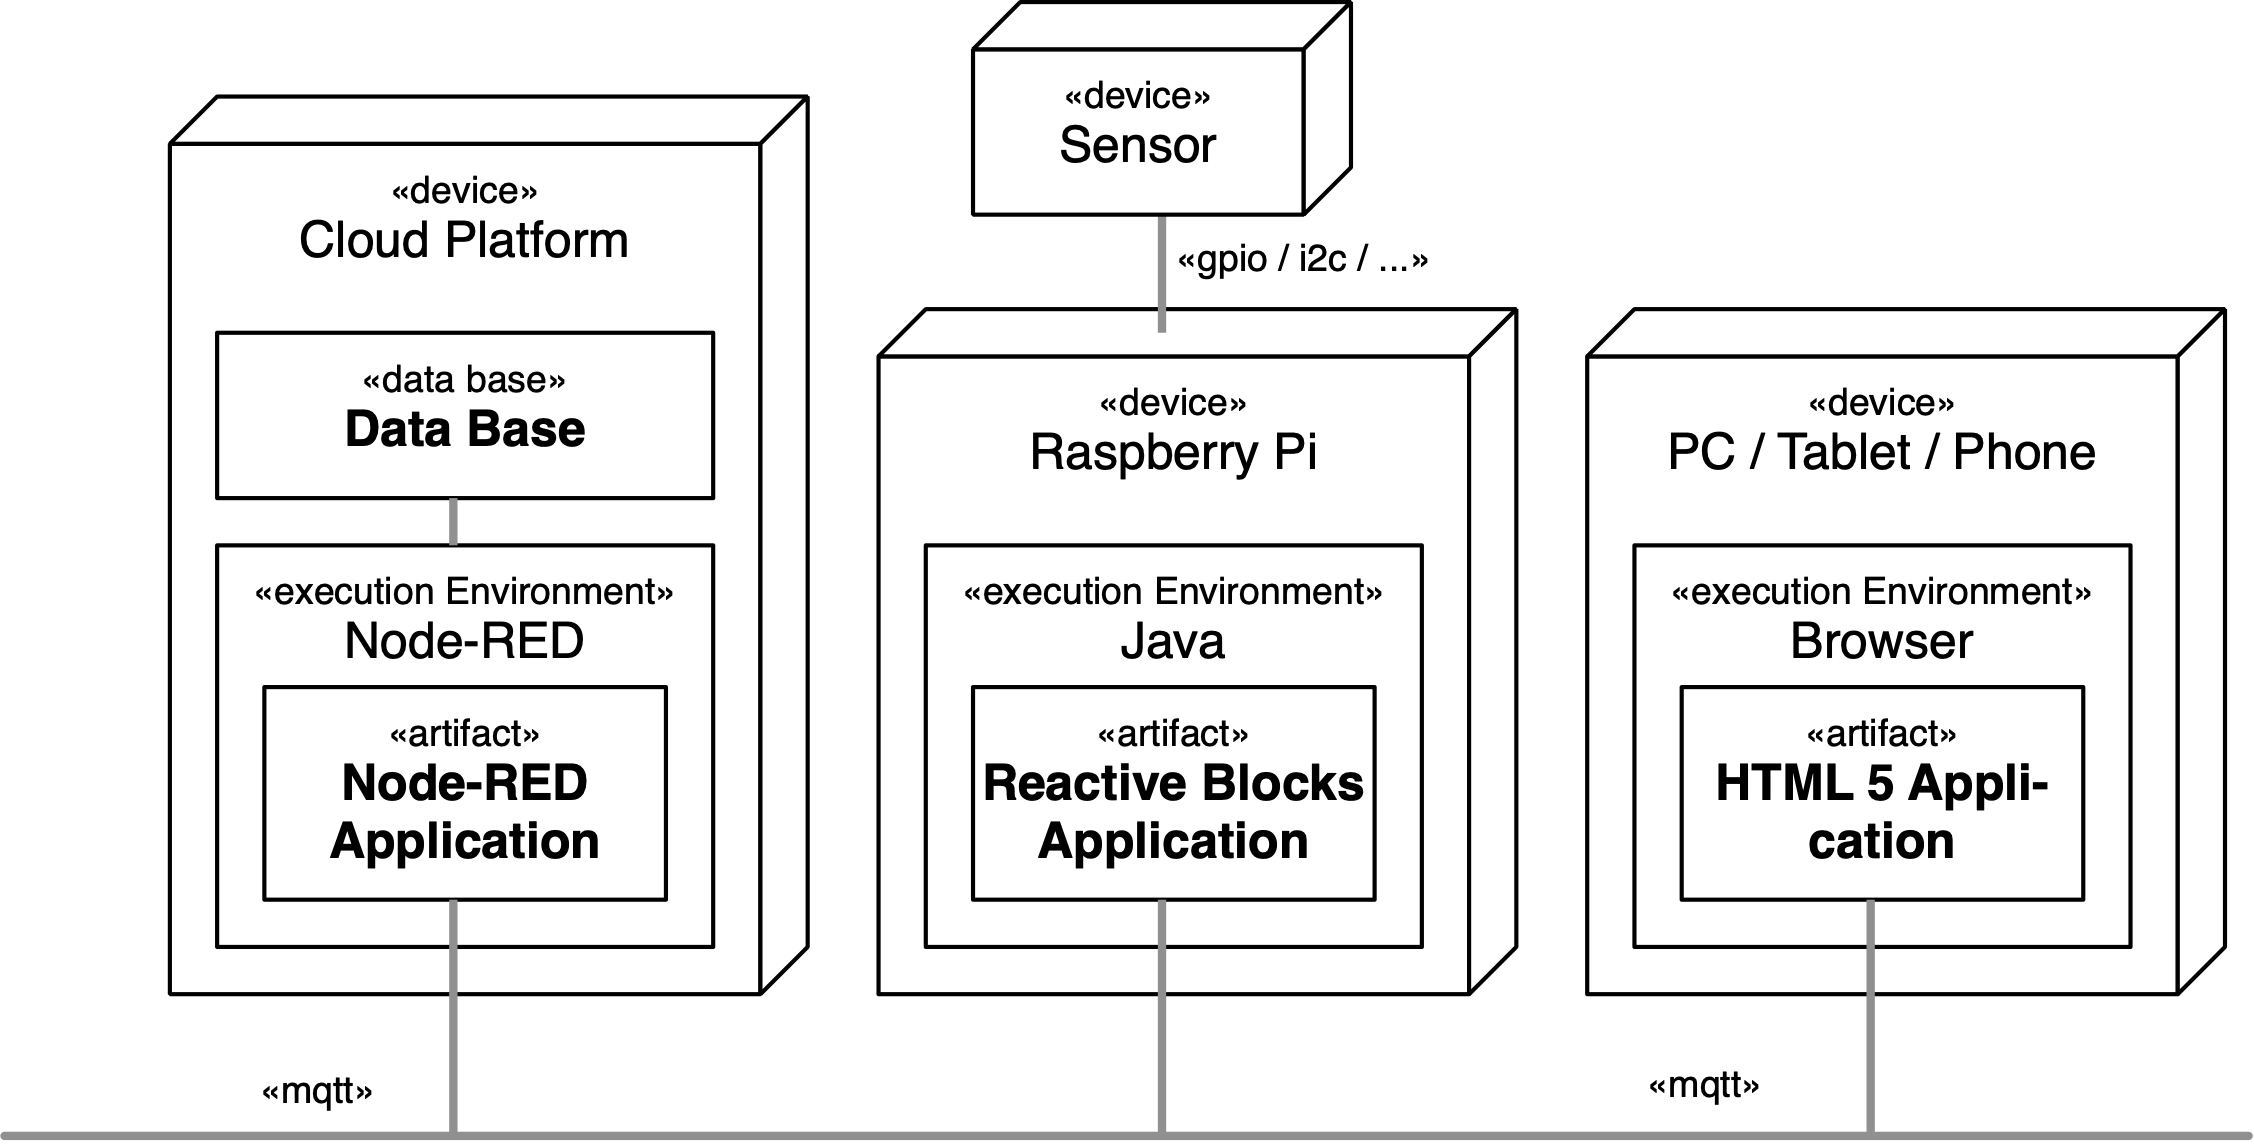
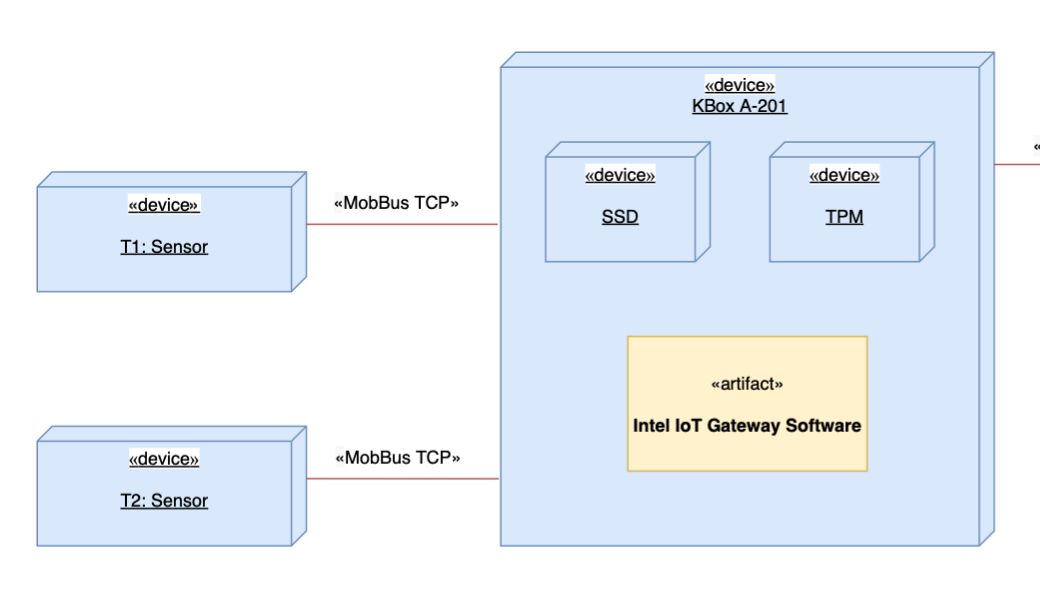
Another example is shown below that follows an entirely different strategy. Here the shared communication medium is highlighted, and components are arranged alongside this shared bus.
For state machines, experiment with the arrangement of states. Usually it is easiert for the reader to get a good sense of orientation if you begin with the initial state in the upper left corner, like in a written document.
Tidying up the Graphics
After your layout is stable, have a look at the finer details.
Lines
Avoid corners in lines that are not necessary.
Nodes
Make sure nodes are aligned. Some tools offer a grid for placement. Often working in a coarse grid is simpler than in a very fine one.
Color
Coloring nodes can make nodes easier to see and distinguish, but can also make them harder to read. Below the coloring seems useful for T1 and T2, but SSD and TPM are harder to read.
Syntax Details
This one may be a very fine detail, but why not doing things right?
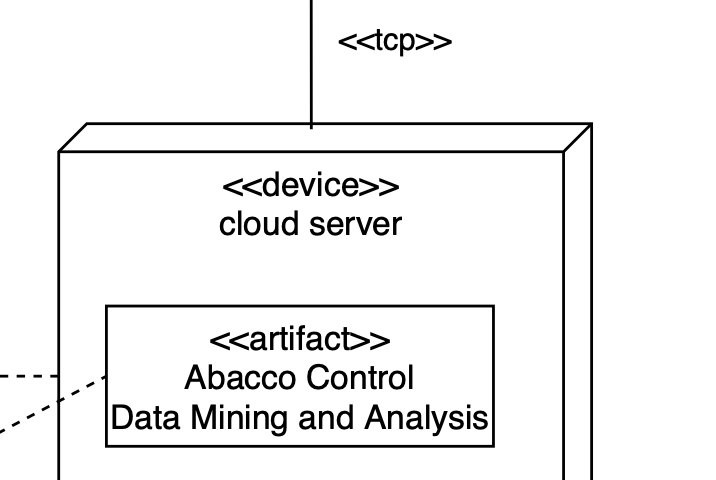
In UML, stereotypes are using the single-character braces (« and »), which are also called guillemets. Use the proper character instead of imitating them with two (like << and >>).
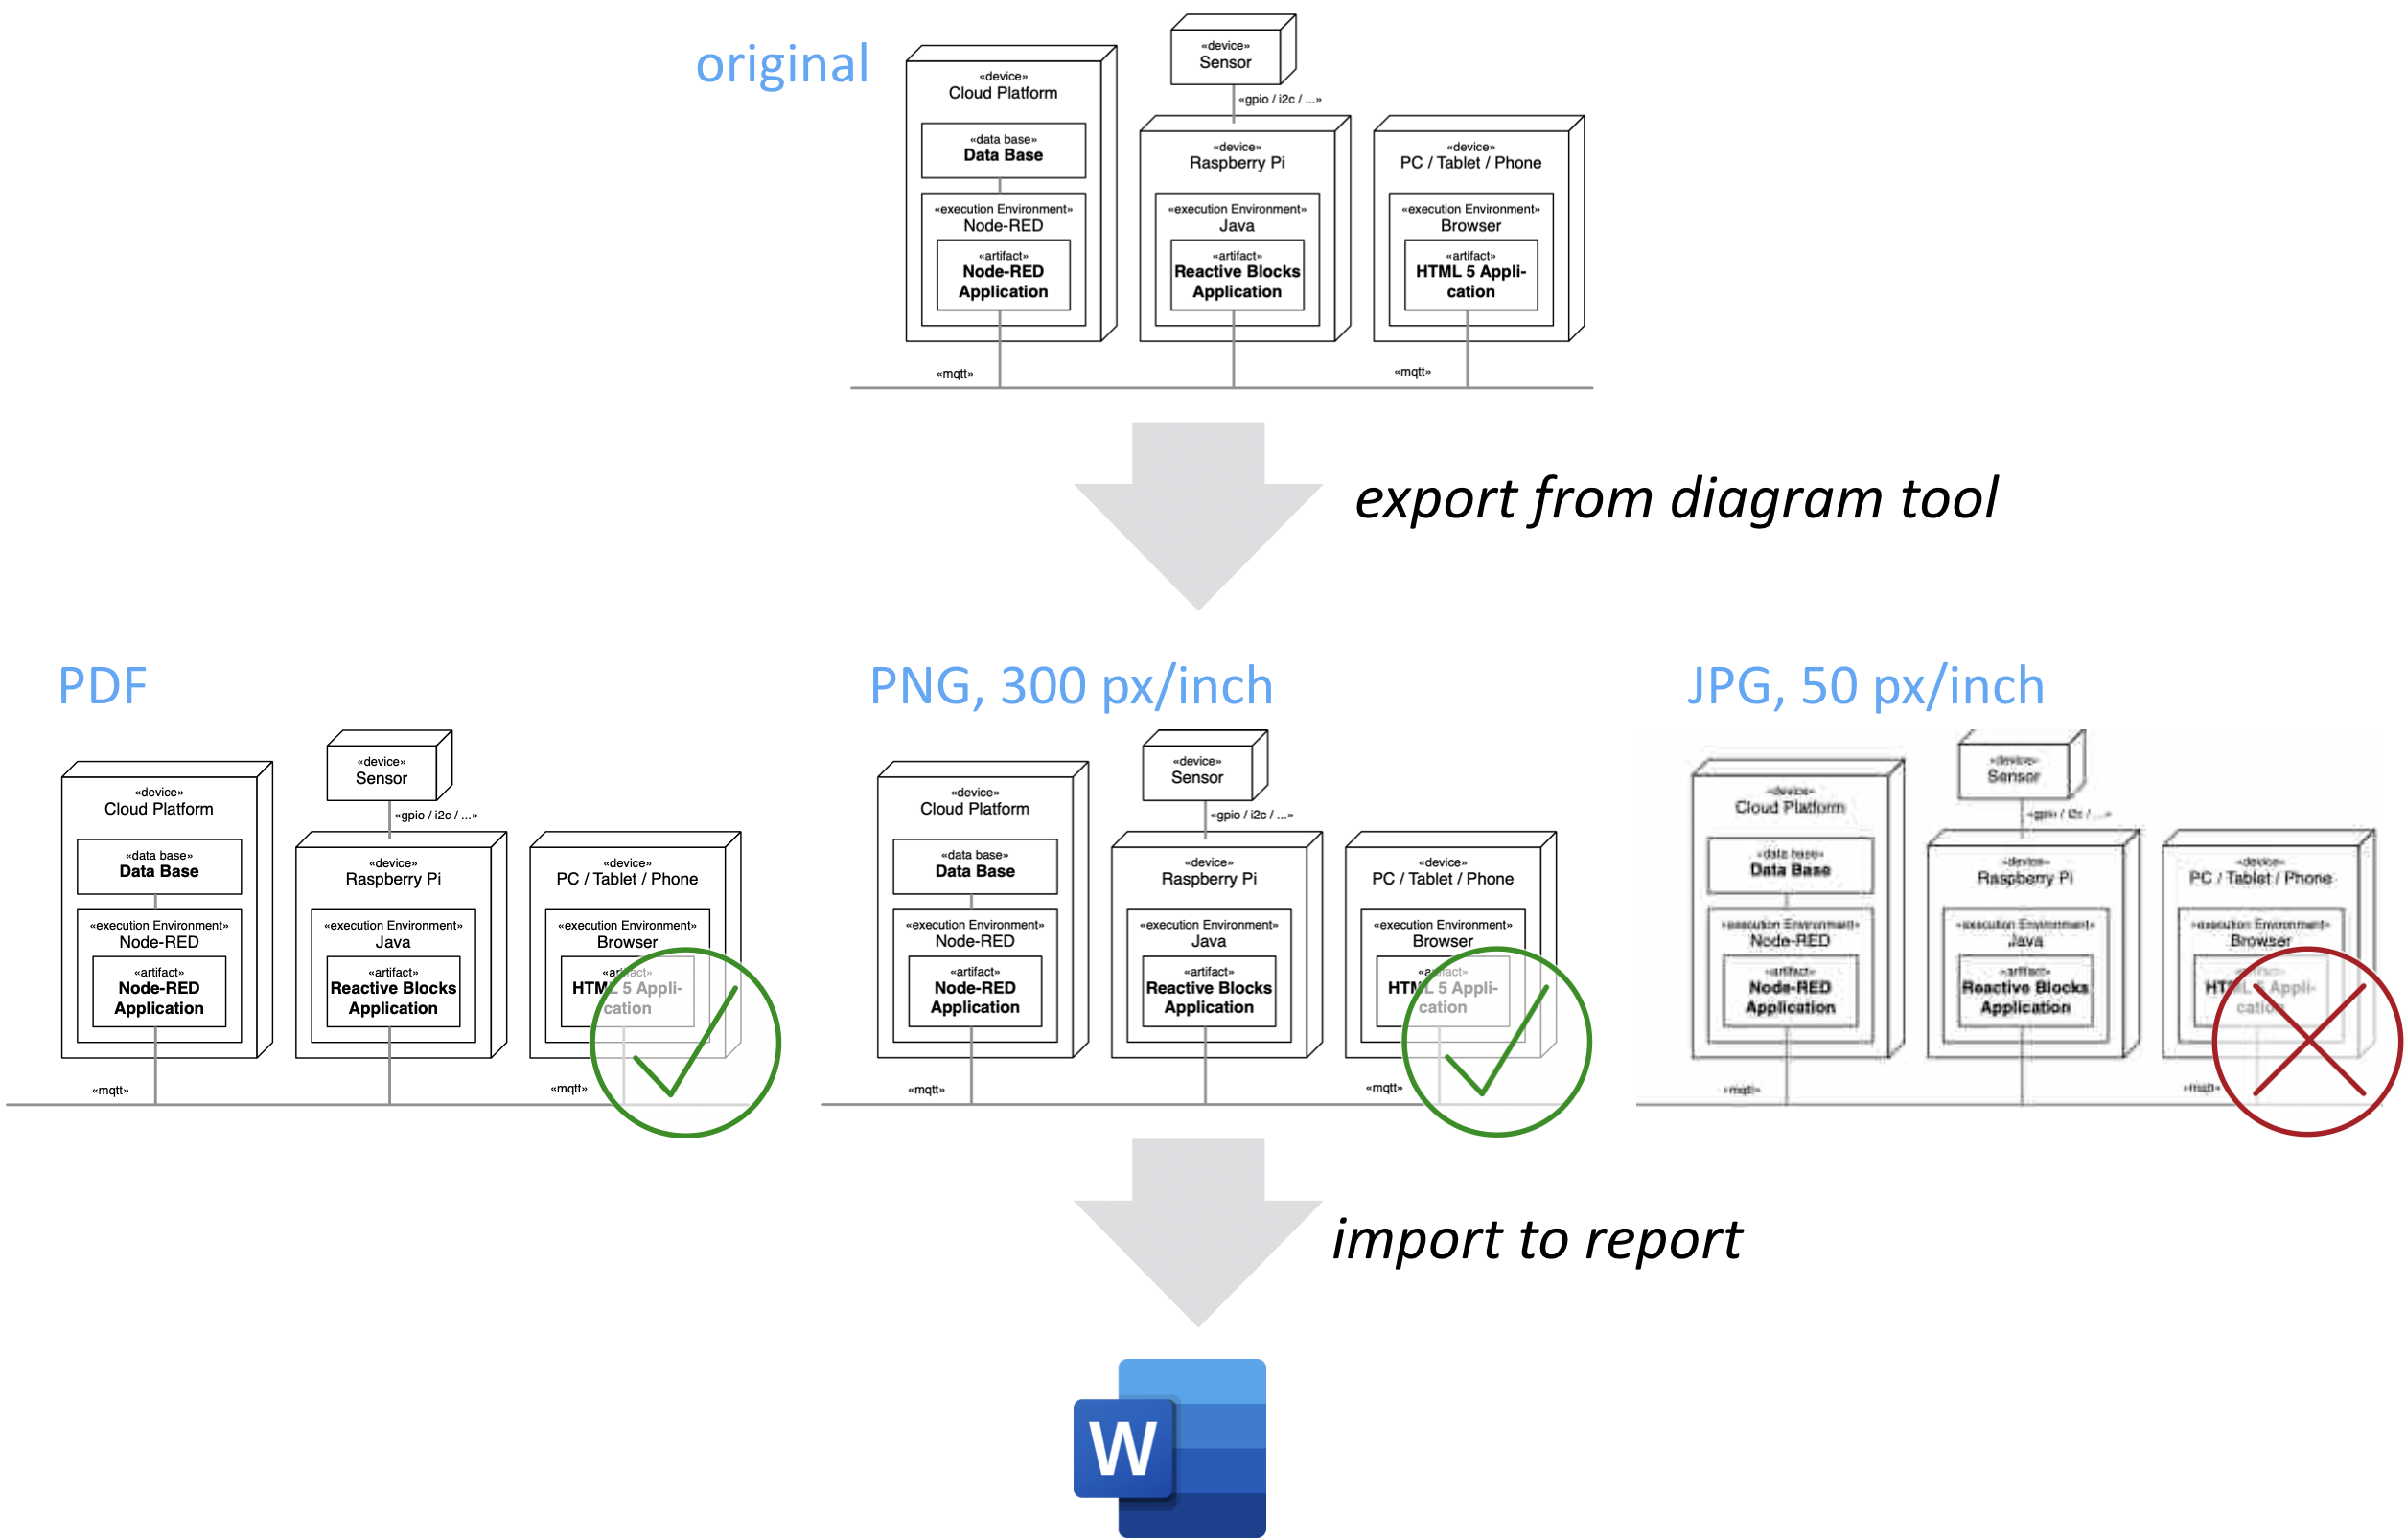
Use PDF or PNG
When you create a digram, try to export it in PDF format from the graphical tool. As a tool for the final report you will most likely use Microsoft Word, which has the option to import PDF graphics. This has the benefit that the graphic is exported in a vectorized format, and not in a pixeled version. If PDF is not available, choose PNG with a resolution that is high enough. That is a pixeled image, but does not use the same compression as JPEG.